Florida’s Economic Outlook Shows Steady Growth
By the close of the 2012-13 fiscal year, several key measures of the Florida economy had returned to or surpassed their prior peaks. Nominal personal income and tourism counts were the most notable among these metrics. Still other measures were posting solid year- over-year improvements, even if they were not yet back to peak performance levels. Looking across the 50 states, the three most-widely used indicators of government financial health illustrate the economic extremes the state faced to get to this point.
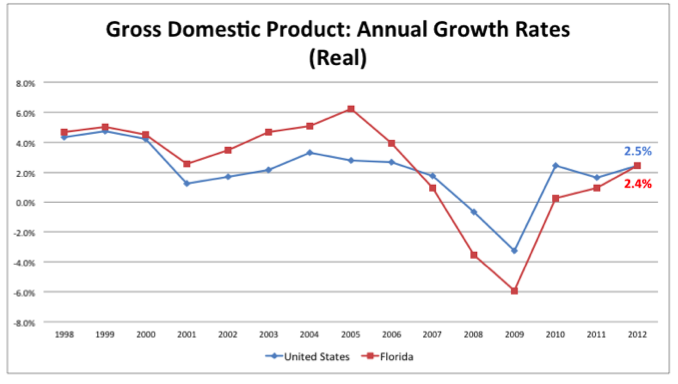
One economic measure for comparing states is the year-to-year change in the State Gross Domestic Product (that is, all goods and services produced or exchanged within a state). Using this measure, Florida was one of the nation’s faster growing states from 1997 to 2006, reaching its peak growth in 2005 and outperforming the nation in the first nine of the last fifteen years. With the end of the housing boom and the beginning of the real estate market correction, the state slipped into two years of negative growth (2008 and 2009). While Florida was not the only state to experience a significant deceleration in economic growth during this period (California, Nevada and Arizona showed similar trends), it was one of the hardest hit. Once the recession ended and the slow recovery began in 2010, Florida’s economy regained its positive footing, registering 0.3 percent growth over the prior year in 2010 and 0.9 percent growth in 2011 (calculations in real dollars). In 2012, the state was ranked 14th in the country in real growth, with a gain of 2.4 percent, just slightly below the national average of 2.5 percent. In terms of current dollars, Florida’s gross domestic product reached $777.2 billion in 2012, moving ahead of its prior peak.
Other factors are frequently used to gauge the health of an individual state. The first of these measures is personal income growth—primarily related to changes in salaries and wages. Quarterly personal income growth is particularly good for measuring short-term movements in the economy. Using the latest revised series, Florida finished the 2012 calendar year with 3.2 percent growth over 2011, putting the state only slightly below the national growth rate of 3.5 percent. Losing some ground in the first quarter of 2013, Florida saw a -1.5 percent change from the last quarter of 2012 and dropped in rank to 39th in the nation. In Florida, losses in both net earnings and property income led to the slow-down. They reflected the expiration of the payroll tax holiday and the acceleration of dividends and salary bonuses into 2012:Q4. First-quarter property income (dividends, interest and rent) fell the most in California ($10.9) billion, but Florida closely followed ($9.3 billion) with a decline in this category greater than in earnings.
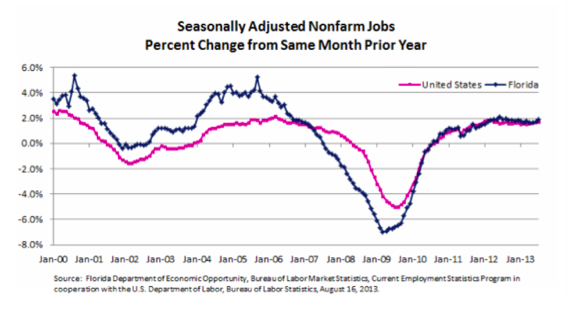
The key measures of employment are typically job growth and the unemployment rate. While Florida led the nation on the good-side of these measures during the boom, the state was worse than the national averages on both measures until August 2010 when Florida experienced its first over-the-year increase in jobs since July 2007. Three years later (July 2013), Florida’s annual job growth rate has been positive for the past 36 months. However, Florida is still 515,100 jobs below its peak during the boom. This indicates that simple rehiring, while necessary, will not be sufficient to trigger a robust recovery. At the current pace, a full recovery to the previous peak non-farm employment level will not occur until Fiscal Year 2016-17 at the earliest. Since population has continued to grow, the reality is actually worse than it appears—it would take the creation of about 900,000 jobs for the same percentage of the total population to be working as was the case at the peak.
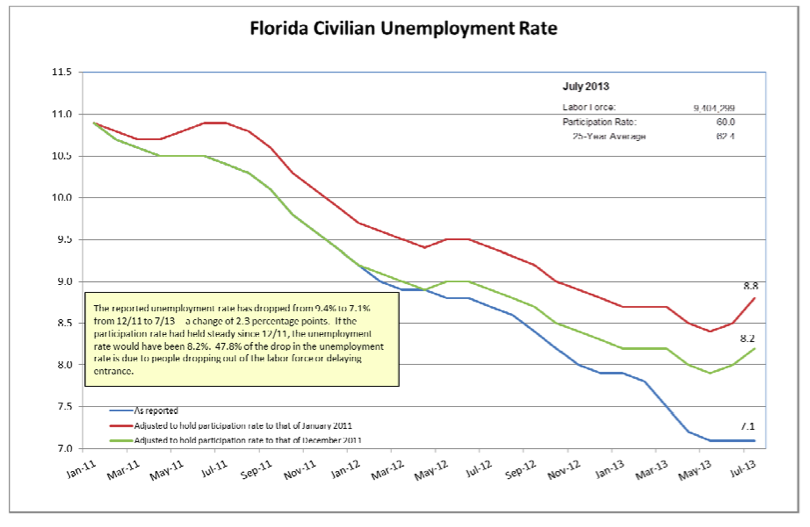
The state’s unemployment rate in July was 7.1 percent, with 665,000 jobless persons. It had been as low as 3.3 percent from January through August 2006 (the lowest unemployment rate in more than thirty years), before peaking at 11.4 percent from December 2009 through March 2010. Following the trend of the past several months, Florida’s July rate is below the national rate of 7.4 percent. Prior to March 2013, Florida had an unemployment rate that equaled or exceeded the nation’s rate for five years.
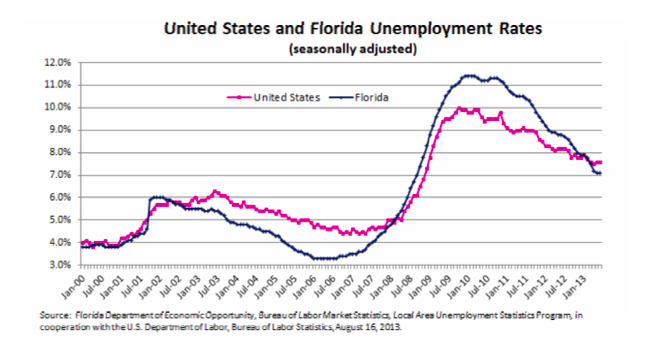
A conundrum appears after reviewing this data—if job creation has been relatively stable, why has Florida seen a marked decline in its unemployment rate? The answer lies in the labor force participation rate. The reported unemployment rate has dropped from 9.4 percent to 7.1 percent from December 2011 to July 2013, a change of 2.3 percentage points. If the participation rate had held steady since December 2011 when the labor force peaked, the unemployment rate would have been 8.2 percent. This indicates that 47.8 percent of the drop in the unemployment rate is due to people dropping out of the labor force or delaying entrance. Even so, this metric has shown improvement from last year when the percentage was significantly higher.
Florida’s average annual wage has typically been below the national average. The preliminary data for the 2012 calendar year showed that it further declined to 87.7 percent of the average for the United States as a whole. Although Florida’s wage level actually increased over the prior year, the national average annual wage increased more.
To a great extent, the slow recovery in the jobs sector is related to the outlook for Florida’s housing market. Construction has lost more jobs in this economic downturn than any other sector. It peaked in June 2006 with 691,900 jobs and at the end of the 2012-13 fiscal year was still down 345,400 jobs (-49.9 percent) from that level. The persistently large inventory of unsold houses coupled with the still sluggish credit market for residential loans continue to dampen residential construction activity and sales. In Fiscal Year 2012-13, single-family private housing starts came in at 48,900 or just below 27 percent of their peak level. And Documentary Stamp Taxes, a strong indicator of housing market activity, were only 40.5 percent of their prior peak as the fiscal year ended.
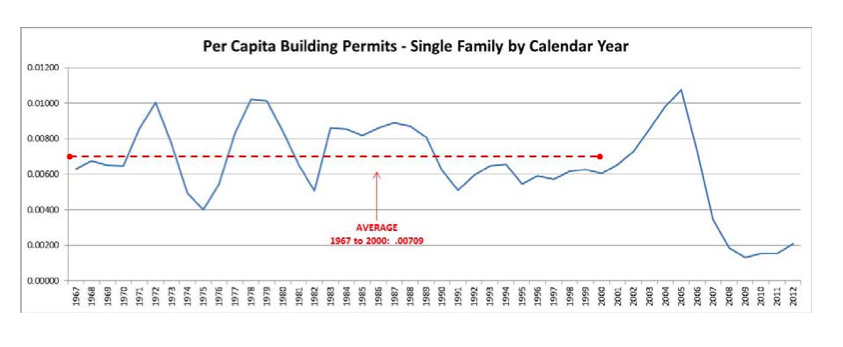
However, the moribund housing market is displaying some signs of life. Building permit activity, an indicator of new construction, is back in positive territory, showing strong (46.2 percent) year-over-year growth for the first six months of the 2013 calendar year. In addition, existing home sales in 2012 showed marked improvement from the prior calendar year, coming in at 84.9 percent of the 2005 banner year sales. They look on track to better that percentage in 2013.
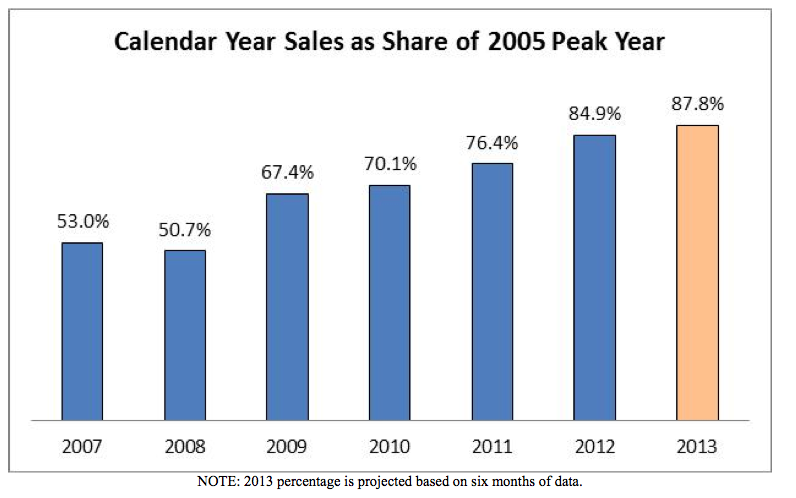
NOTE: 2013 percentage is projected based on six months of data.
It is easy to see the improvement that is occurring across Florida’s economy, but those achievements should be put in perspective. First, the end of the housing boom brought lower activity and employment in the construction and financial fields, as well as spillover consumption effects in closely related industries: appliances, carpeting, and other durable goods used to equip houses. This began in the summer of 2005 when the volume of existing home sales started to decline in response to extraordinarily high prices and increasing mortgage rates. Closely linked to the housing industry, Florida’s nonagricultural employment annual growth rate peaked in fall of 2005. By the summer of 2006, existing home prices began to fall, and owners started to experience negative wealth effects from the price deceleration and accompanying losses in property value. Mortgage delinquencies and foreclosures became commonplace as property prices further tanked in 2007, and the unemployment rate began to climb as part of the slow slide into a national recession that was ultimately declared in December 2007. By the fall of 2008, Florida’s homegrown problems with the housing market were giving way to several worldwide phenomena: a national recession that was spreading globally and a credit crisis that was threatening to bring down the world’s largest financial institutions. As the subprime mortgage difficulties spread to the larger financial market, it became clear that any past projections of a relatively quick adjustment in the housing market were overly optimistic. Forecasts were dampened through the end of the fiscal year, and then again as the excess inventory of unsold homes was further swelled by foreclosures and slowing population growth arising from the national economic contraction. After the recession officially ended in June 2009, initial improvements on both the state and national fronts sputtered as the recovery struggled to take hold. While a Florida recovery has been underway since the late spring of 2010, the state still has several years to go to return to more typical conditions.
FORECAST ~ Long-Term Trends
For Florida, it appears that the extreme financial and economic stress experienced over the last few years reached its bottom sometime during the spring of 2010. In the forecast, months of modest growth are expected before normalcy is largely achieved by Fiscal Year 2016-17 with construction and real estate still presenting notable exceptions. The remaining questions focus on the actual pace of Florida’s recovery and the risk associated with the delayed resolution of the federal Sequester and the statutory debt ceiling dispute. Each of these issues is discussed separately below.
Pace of Florida Recovery
The pace of Florida’s recovery will be driven in large measure by the time it takes the construction industry to revive. Vigorous home price appreciation that outstripped gains in income and the use of speculative financing arrangements made Florida particularly vulnerable to the decelerating housing market and interest rate risks. In 2006, almost 47 percent of all mortgages in the state were considered “innovative” (interest only and pay option adjustable-rate mortgages). With the ease of gaining access to credit, long-term home ownership rates were inflated to historic levels—moving Florida from a long-term average of 66.3 percent to a high of over 72 percent. Essentially, easy, cheap and innovative credit arrangements enabled people to buy homes who previously would have been denied. This is borne out by the steady decline in the homeownership rates since the peak—the latest data (Quarter 2 of the 2013 calendar year) placed the annual rate at 66.0 percent, actually slightly below the long-run average of 66.3 percent.
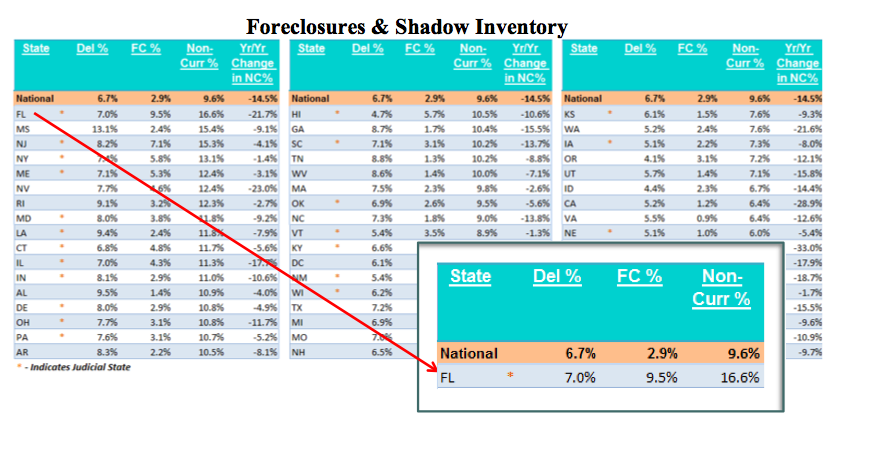
The surging demand for housing led many builders to undertake massive construction projects that were left empty when the market turned. While the national inventory of unsold homes had improved to a more normal 5.1 months in July 2013, the situation is more complicated in Florida. Foreclosures have further swelled the state’s unsold inventory of homes and will continue to do so in the near-term. Originally related to mortgage resets and changes in financing terms that placed owners in default, delinquencies were further boosted by persistently high levels of unemployed persons in financial distress. Private sector data for July 2013 shows that Florida was the highest state in the country for both the number of foreclosure filings and the rate of foreclosure. While many of the legal issues regarding the processing of foreclosure documents were largely resolved by the National Mortgage Settlement Agreement finalized in early 2012, foreclosure starts have just recently begun returning to expected levels. Prior to the increase of foreclosures in 2007, the average foreclosure took 169 days or slightly less than six months to process. Today, a foreclosure takes 907 days to process (about 2.5 years), the third longest period in the nation. The abnormally long time to complete the foreclosure process slows the placement of these properties on the market—and in the interim, the actual backlog continues to build. However, there is some promising news. With the exception of the June data shown below, the front end of the foreclosure stream—comprised of mortgages newly falling into delinquency—has steadily declined over the course of the 2013 calendar year. There are several reasons for this, but one is the federal homeowner assistance program activity. Florida’s “underwater” homes declined from a high of 50 percent of all residential mortgages to about 26 percent in the most recent data. Absent some intervention, these homeowners were the most likely to move into (or already be in) seriously delinquent status, so a decline in these numbers is a good sign.
Foreclosures & Shadow Inventory
?Based on the most recent data, the excess supply of homes in Florida continues to hold steady. Subtracting the “normal” inventory of approximately 50,000 and using the most recent sales experience, the state will need significant time to work off the current excess—about two years in the optimistic scenario, likely longer. Because the state is so diverse, some areas will reach recovery much faster than other areas. However, the overall Florida economy is unlikely to significantly improve until new construction comes fully back to life, and that won’t happen until the existing inventory is reduced. Recent rises in mortgage and construction loan rates present a new challenge.
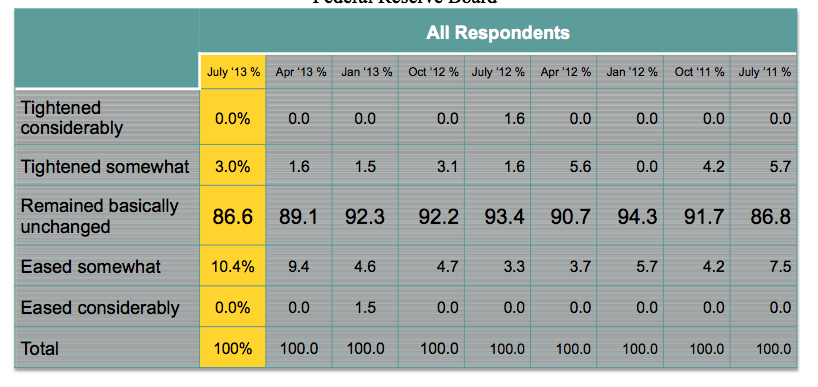
In May 2013, over 35 percent of all sales were either REO (bank-owned after an unsuccessful sale at a foreclosure) or short sales, and most of these sales were heavily discounted. Even more remarkable, over 37 percent of the sales were cash sales— leaving only a minority of the sales (28 percent) using financing arrangements. In part, these statistics are influenced by low housing prices that attract investors willing to wait for the market to improve, but they are also influenced by extremely tight credit conditions. Banks are still reporting that they are less likely than in prior years to originate mortgages to any borrowers apart from those with the strongest credit profiles. In addition, down payments of 20 percent or more are also being required. The Federal Reserve Board conducts a Senior Loan Officer Survey of bank lending practices once each quarter. While conditions had been holding steady (albeit at elevated levels), the July 2013 results showed some tightening of standards for approving applications from individuals for prime residential mortgage loans. These results pose a risk for the current forecast if they continue.
July 2013 Senior Loan Officer Opinion Survey on Bank Lending Practices Federal Reserve Board
Currently, the key housing market metrics do not show a return to their peak levels until 2020-21 (residential construction expenditures and total construction expenditures). The
rest either do not return to their peak at all during the forecast horizon (construction employment, multi-family starts, private housing starts and median price) or very late in the period (2022-23: single-family starts).
There is a potential upside risk for construction if rising mortgage rates and construction loan costs do not put the brakes on recent activity. The “shadow inventory” of homes that are in foreclosure or carry delinquent or defaulted mortgages may contain a significant number of “ghost” homes that are distressed beyond realistic use, in that they have not been physically maintained or are located in distressed pockets that will not come back in a reasonable timeframe. This means that the supply has essentially become two-tiered – viable homes and seriously distressed homes. To the extent that the number of viable homes is limited, new construction may come back quicker than expected.
Federal Sequester and the Statutory Debt Ceiling Dispute—A New Fiscal Cliff
Given the strong public—and economic—reaction to the financial turmoil in August 2011, it is striking that the “fiscal cliff” faced by United States in January 2013 had as little immediate effect as it did. Caused by the intersection of three major deadlines and a potential debt showdown, the potential magnitude of the “fiscal cliff” was largely unknown until after the November elections. Both the Congressional Budget Office and the International Monetary Fund projected that, if left intact, the collective impact of these events would be to throw the United States back into a recession. Ultimately, last- minute resolutions were found for all of the issues—but mainly by kicking the can down the road. Now, the United States is facing yet another debate on alternatives to the Sequester and the level of the statutory debt ceiling as the temporary solutions run out.
• Automatic Sequester Provisions—Essentially the Sequester is the enforcement mechanism used to ensure that $1.2 trillion in savings are produced over a nine- year period through a combination of domestic and defense discretionary spending reductions. This meant cuts of roughly 10 percent for defense spending for Federal Fiscal Year 2013 and 9 percent for non-defense spending in non- exempt programs. However, the Automatic Sequester provisions expected to take place January 1, 2013, were first extended to March 1, 2013, and then left largely intact—but at levels reduced by two months—until September 30, 2013. In addition, many of the Sequester’s expected early effects were muted through the use of federal reserves, targeted congressional fixes and contracting delays.
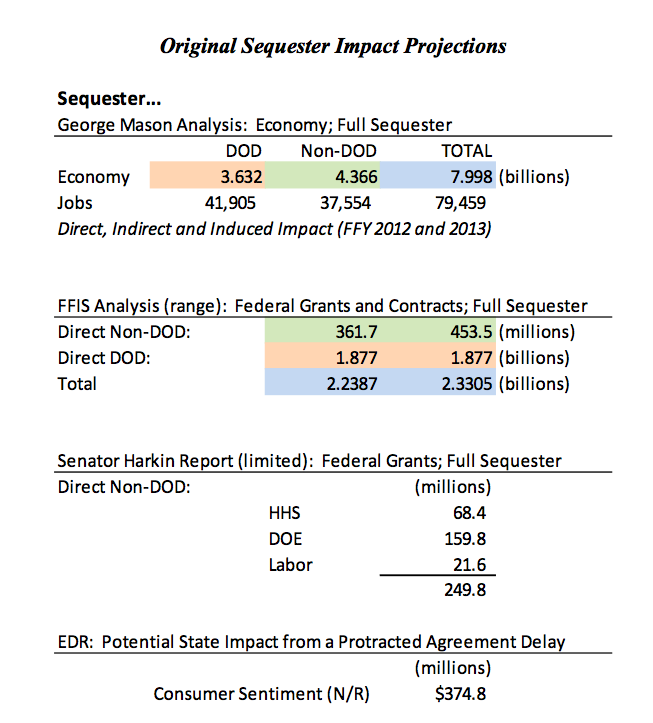
These solutions will be largely unavailable if the Sequester continues into future fiscal years, meaning that the cumulative effects will come closer to the original predictions. While it is clear that there is no meaningful support for the current Sequester provisions, agreement has not been reached on a long-term replacement. It is likely that any of the proposed alternatives will attempt to generate a similar amount of savings and have an equal or greater detrimental impact on Florida’s economy. Although the final results remain to be seen, a table from last year is replicated below to suggest potential magnitude.
• Statutory Debt Ceiling—The House and Senate passed and the President signed HR 325 (“The No Budget, No Pay Act”) to waive the statutory debt limit through May 18, 2013, allowing the Treasury to borrow above the current $16.4 trillion limit until then. Due to technical adjustments available to the Treasury, continued borrowing is available for a limited time. The Congressional Budget Office projects that “those measures will be exhausted in either October or November of this year.”
If the new “fiscal cliff” caused by the intersection of missed budget deadlines and a debt ceiling close to the breach is not avoided or results in a protracted battle, it will negatively affect the assumptions contained in Florida’s Economic Outlook.